Etukudo
The minor loss coefficient measures a fluid’s energy loss in a pipe due to the presence of fittings, valves, and other impediments. Moreover, in industry, the letter ‘K’ represents this coefficient and is also commonly called the resistance coefficient. In this article, you will learn more about the minor loss coefficient, how to determine minor loss coefficient, and how to reduce these losses in a pipe.
More about Minor Loss Coefficient
Generally, in a flow system, there are losses a fluid passes through the pipes and other features. Moreover, in industry, engineers classify these losses into major and minor. Major losses occur due to friction and minor losses occur due to components in the pipe.
Characterizing the minor losses involves one of two methods. The first method, known as the equivalent length method, equates the head loss of the valve/fittings to a length of pipe that would cause equivalent friction losses. The other method uses the resistance coefficient or minor loss coefficient to estimate the head loss.
How to Determine Minor Loss Coefficient
The minor loss coefficient is an empirical value. Thus, determining its value for an application requires extensive experimentation. Fortunately, scientists and researchers have carried out these experiments for a variety of valves, fittings, and other appurtenances common in flow systems. In addition, these professionals documented the coefficient values for various flow scenarios in charts and tables.
Minor Loss Coefficient Chart
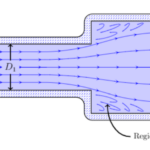
Minor loss coefficient charts exist for a variety of flow features and conditions. For example, the chart below shows coefficient values when there is sudden enlargement or contraction in flow lines.
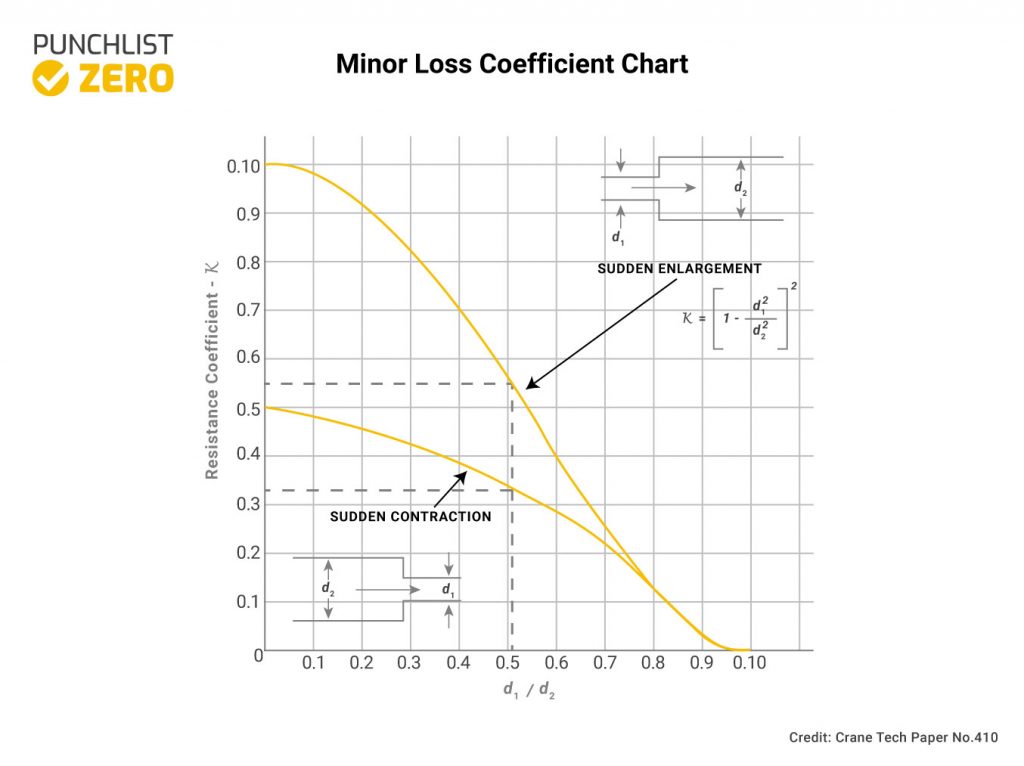
For such an application, the important parameter is the ratio of the diameters of the smaller and larger pipe sections. Inflow diameter serves as the numerator, while the outflow diameter is the denominator in this ratio. After determining this ratio, the minor loss coefficient can be read from the chart. Although the coefficient chart varies according to the flow feature in question, the approach to obtaining the coefficient value is like the one in this section.
Minor Loss Coefficient Table
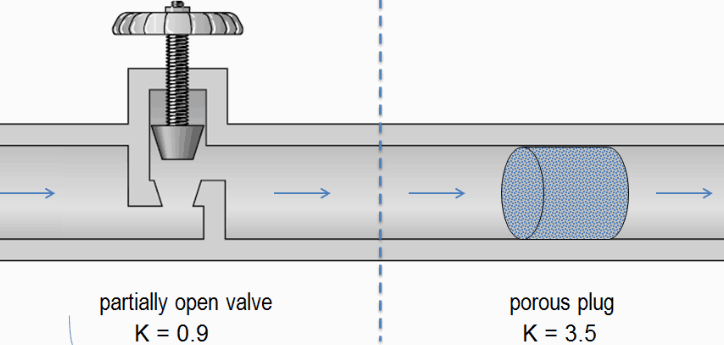
Minor loss coefficient tables serve as another source for getting the ‘K’ values for most flow applications. Like the charts, there are coefficient tables for different features. Generally, these tables contain the coefficient value, the type of fitting, and other details such as the position of a valve. With this information, an engineer can select the appropriate value to use in quantifying the losses in a system.
| Fitting | Type | K |
| Gate valve | Fully open | 0.17 |
| 3/4 open | 0.90 | |
| 1/2 open | 4.50 | |
| 1/4 open | 24.00 | |
| Plug disk | Fully open | 9.00 |
| 3/4 open | 13.00 | |
| 1/2 open | 36.00 | |
| 1/4 open | 112.00 | |
| Butterfly valve | θ = 5° | 0.24 |
| θ = 10° | 0.52 | |
| θ = 20° | 1.54 | |
| θ = 40° | 10.80 | |
| θ = 60° | 118.00 | |
| 45° elbow | Standard (R/D = 1) | 0.35 |
| Long radius (R/D = 1.5) | 0.20 | |
| 90° elbow curved | Standard (R/D = 1) | 0.75 |
| Long radius (R/D = 1.5) | 0.45 | |
| 90° elbow square or miter | 1.30 | |
| 180° bend | Closed return | 1.50 |
| Tee, run through | Branch blanked | 0.40 |
| Tee, as elbow | Entering in run | 1.00 |
| Entering branch | 1.00 | |
| Tee, branching flow | 1.00 |
In summary, minor loss coefficient charts and tables serve as quick references for determining the coefficient values in an application. In addition, these values often constitute the inputs into sophisticated simulation software, which evaluate minor losses in complex systems.
Minor Loss Coefficient Formula
After determining the appropriate ‘K’ value for each feature in an application, it is simple to evaluate the respective head losses. The minor head loss (hm) is a function of the minor loss coefficient (K), the flow velocity (u), and the acceleration due to gravity (g).
![\[ h_{m}=\frac{K\left ( u \right )^{2}}{2g} \]](https://punchlistzero.com/wp-content/ql-cache/quicklatex.com-f5c08eee2bf06662a40003092c6ef03a_l3.png "Rendered by QuickLaTeX.com")
From the formula, the minor loss in a system is greatly dependent on the velocity of the flow. As a result, the greater the velocity, the greater the minor losses.
How to Reduce Losses in a Pipe
When reviewing how to reduce minor losses or their coefficient, the first step is to assess the root cause. One is due to friction in the appurtenances, while the other is because of flow separation due to obstructions, bends or diameter changes. Thus, the following steps can work in reducing minor losses:
- Minimize interior surface roughness of all fittings, bends, and other accessories along the flow line. Because a reduction in roughness is equivalent to a reduction in friction. To achieve this, planning to avoid rough surfaces should commence from the material selection and fabrication stages.
- Keep the number of tees, valves, and elbows in a flow system to a bare minimum. Moreover, engineers should use such fittings only when necessary. Part of a piping system design should include a drawing review with the goal to eliminate unnecessary fittings. Although minor loss may seem small, significant build-up can occur. This holds especially true in large complex systems such as refineries and city water supply systems. In addition, the angle of bends should be as small as possible. For example, engineers should replace 90° bends with gentle bends. And there should be no abrupt change in the flow direction.
- Avoid sudden enlargement and contraction of the flow area. So, when connecting two pipes of different diameters, ensure a gradual transition from one pipe to the other. As a result, the minor loss coefficient reduces significantly.
- Finally, it is necessary to eliminate any obstruction along the flow line. Hence, the design of fittings should have minimal interference with the flow. Also, remove particle build-up along the flow line via pigging or other means.